
Getting started with Tableau

By Chinaza MaryTheresa Akwue
If you’re new to Tableau, you might feel a little overwhelmed by all the features and buttons. But don’t worry! This guide will walk you through the basics—from downloading Tableau to creating your first chart—in a simple, beginner-friendly way.
Step 1: Downloading and Installing Tableau
First things first, you need Tableau! If you don’t have it yet, here’s how to get started:
1. Visit Tableau’s official website and download Tableau Public (it’s free). Click here to download Tableau Public.
2. If you have access to Tableau Desktop, install that instead—it has more features, but it’s paid.
3. Follow the installation steps, and once it’s done, open the application.
Below is what it looks like when you open the application.
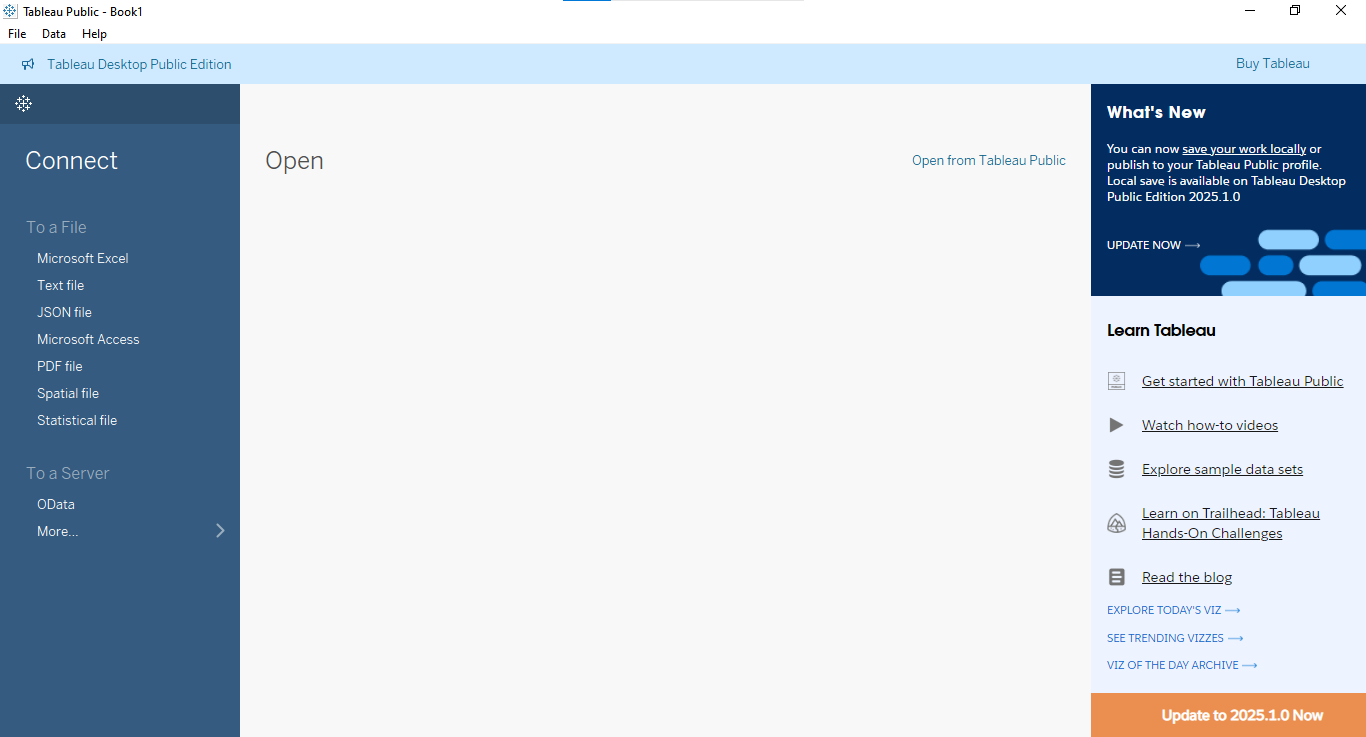
Now, let’s move on to the next part—connecting to data!
Step 2: Connecting to a Simple Data Source
To work with Tableau, you need data. For this tutorial, we’ll use a simple Microsoft Excel file (you can also use a CSV file, Google Sheets, or databases).
1. Open Tableau and click “Connect to Data”.
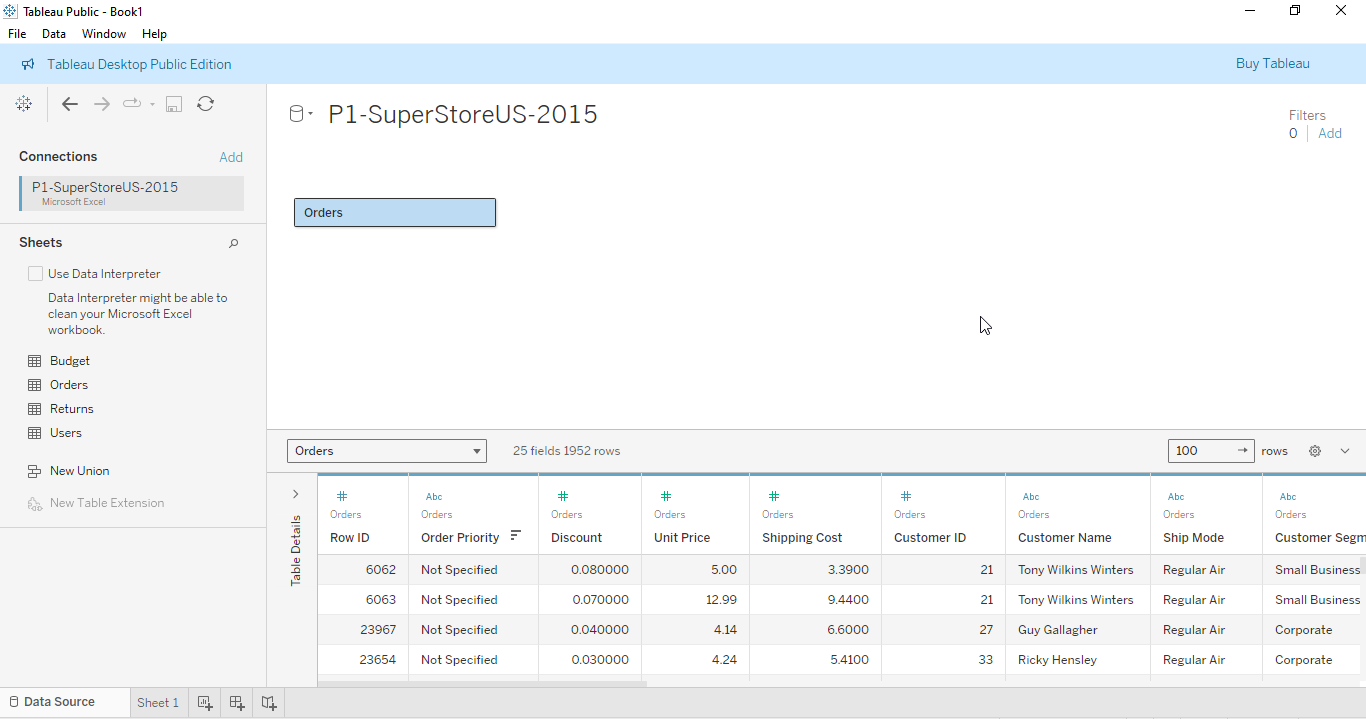
2. Select “Microsoft Excel” and choose your dataset.
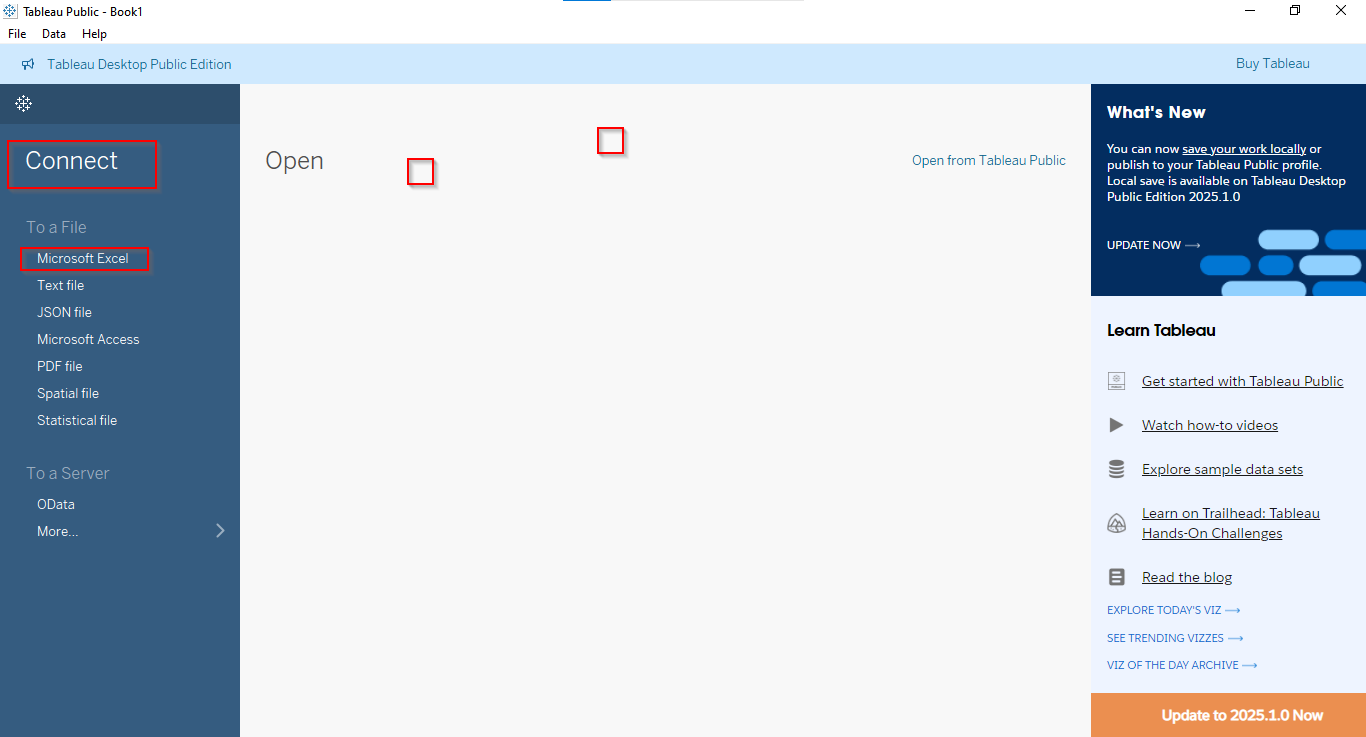
3. Once loaded, you’ll see a preview of your data—think of it as your starting point for analysis.
Now, let’s explore Tableau’s interface.
Step 3: Understanding the Tableau Interface
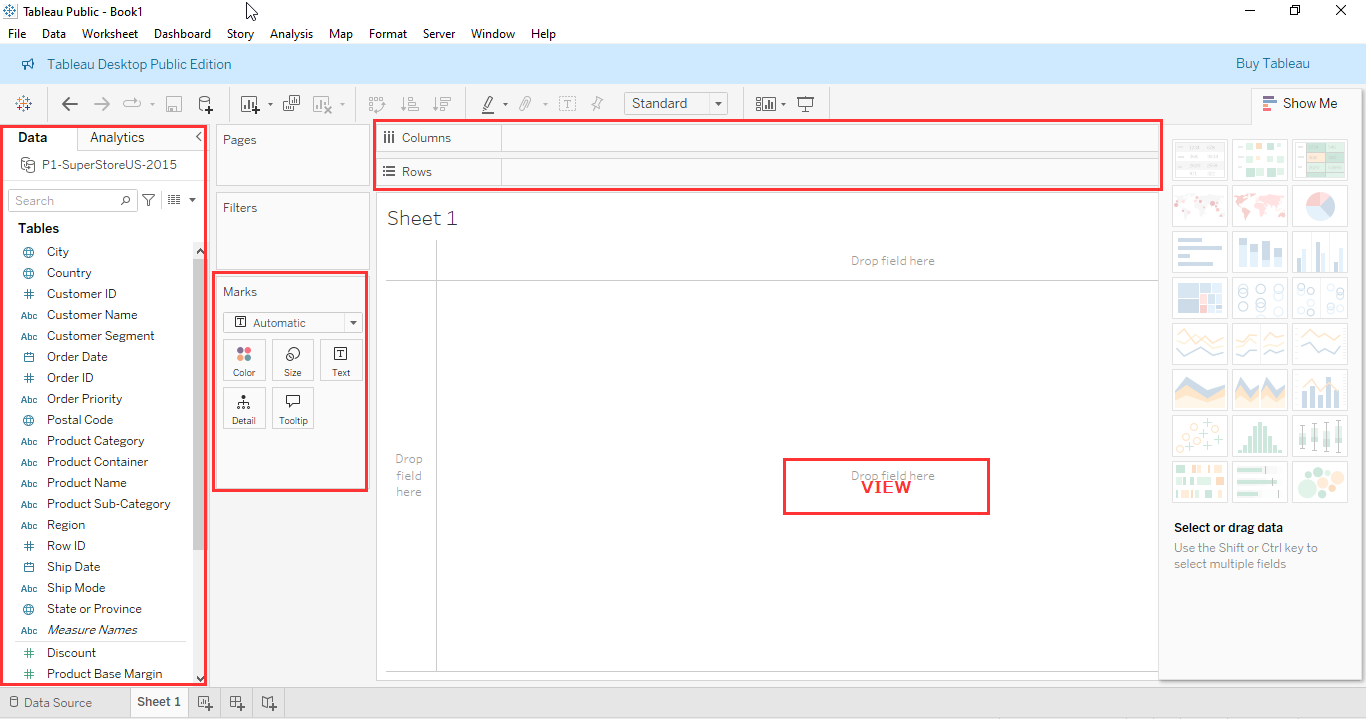
When you open a new worksheet, you’ll see:
- Data Pane (left side) – This holds all your fields (dimensions & measures).
- Columns & Rows Shelves (top) – This is where you drag fields to build charts.
- Marks Card (middle) – Used to customize colors, labels, and tooltips.
- View (center) – Your actual visualization appears here.
Now that you know where things are, let’s build your first chart!
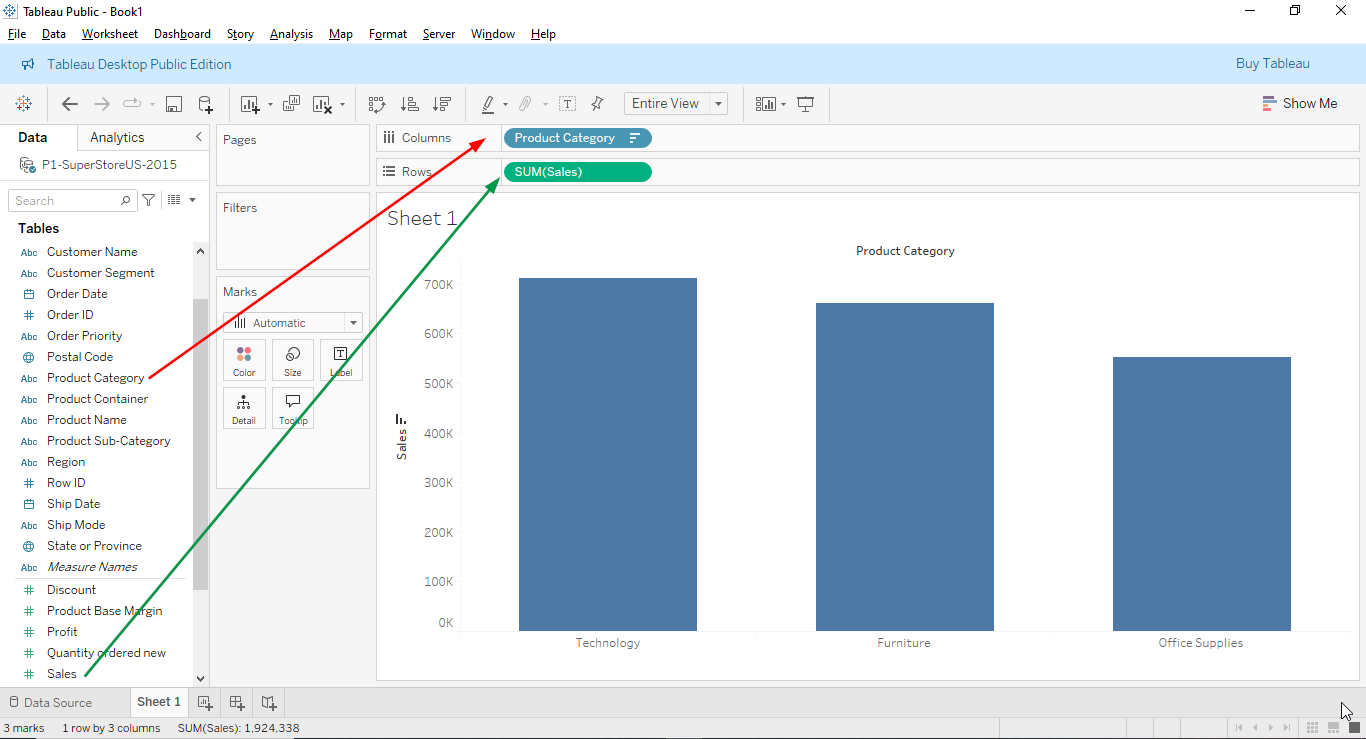
Step 4: Creating a Basic Bar Chart
Let’s say you have a dataset with Sales and Product Categories. Here’s how to make a simple bar chart:
1. Drag “Product Category” to Columns.
2. Drag “Sales” to Rows.
3. Tableau will automatically create a bar chart!
Want a line graph instead?
- Just change the chart type by selecting “Line” under the Marks Card.
Step 5: Drag-and-Drop Magic
Tableau is super intuitive because of its drag-and-drop functionality. You don’t need to write code—just drag fields and drop them onto shelves.
- Want to add colors? Drag a field, e.g., Region, to the Color section in the Marks Card.
- Want labels? Drag your measure, e.g., Sales to Label.
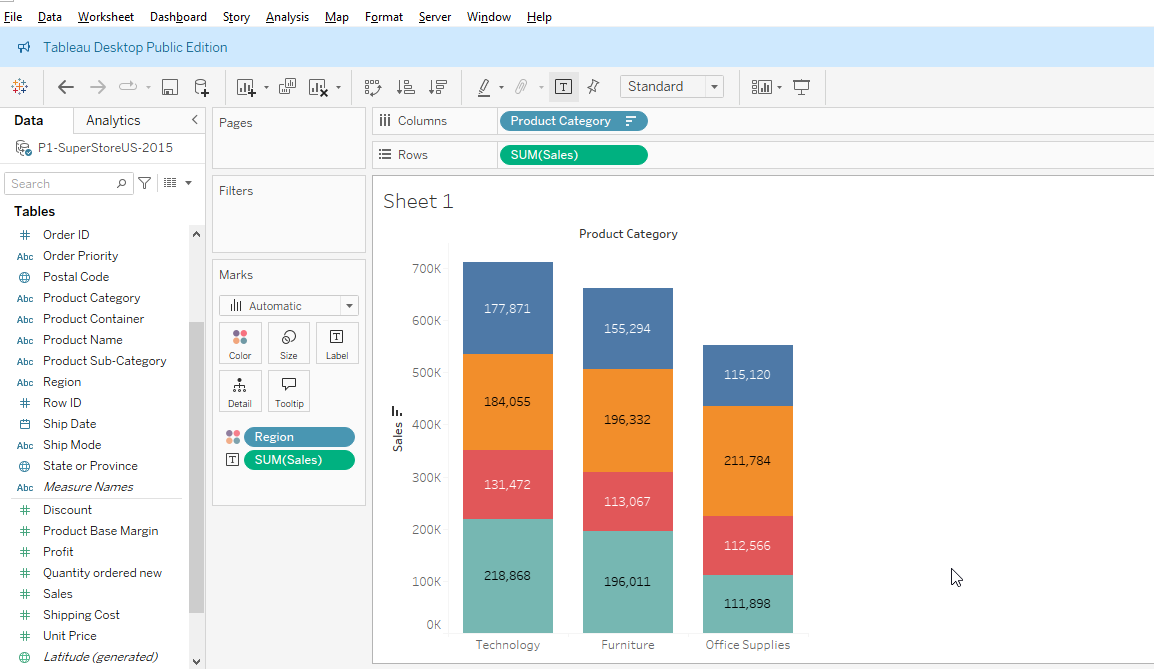
Play around with it, and you’ll see how easy it is to customize your charts!
Final Thoughts
And there you have it—your first Tableau chart!
You’ve learned how to install Tableau, connect to data, navigate the interface, and create a basic visualization. From here, you can explore more chart types, dashboards, and analytics tools.
Ready to Take Action?
1. Dive into our online data bootcamp! Learn at your own pace with our expert-led virtual programs designed to fit into your schedule. Become a qualified data expert in just 4 months and unlock your potential and land your dream career.
2. Learn more about our Data BootCamp programs by reading the testimonials of our graduates. Click HERE to access the testimonials.
3. You can also sign up for 1:1 personal tutoring with an expert instructor or request other solutions that we provide, which include data research, tech skill training, data products, and application development. Click HERE to begin.
4. Get in touch with us for further assistance from our team OR via email at servus@resagratia.com or our Whatsapp Number via +2349042231545.
- Step 1: Downloading and Installing Tableau
- Step 2: Connecting to a Simple Data Source
- Step 3: Understanding the Tableau Interface
- Step 4: Creating a Basic Bar Chart
- Step 5: Drag-and-Drop Magic
- Final Thoughts
- Ready to Take Action?
Empowering individuals and businesses with the tools to harness data, drive innovation, and achieve excellence in a digital world.
2025Resagratia (a brand of Resa Data Solutions Ltd). All Rights Reserved.